Musical Constellations
How to redesign Spotify's music discovery?
🖼️ Exhibited at the Fractal '25

Responsibilities
Data visualization, development, interaction design, and UX research
Timeline
Nov-Dec'23
Tools
Adobe Illustrator, D3.js, Django, Flourish, Gephi, Jupyter Notebook, Spline, Spotify APIs & Zoom
Team
Solo
TLDR
Goal
The project aims to provide a more meaningful and engaging way for users to discover new artists and genres by highlighting collaborations and relationships within a specific music industry.
It moves beyond traditional, algorithmic recommendations and social media trends to offer a richer, more active discovery experience.
Problem
In the digital age, music discovery is often passive and limited. Many users rely on a small number of trending songs or narrow algorithmic playlists, leading to a lack of meaningful exploration. This can create a disconnect from the wider music landscape, especially in local or niche scenes.
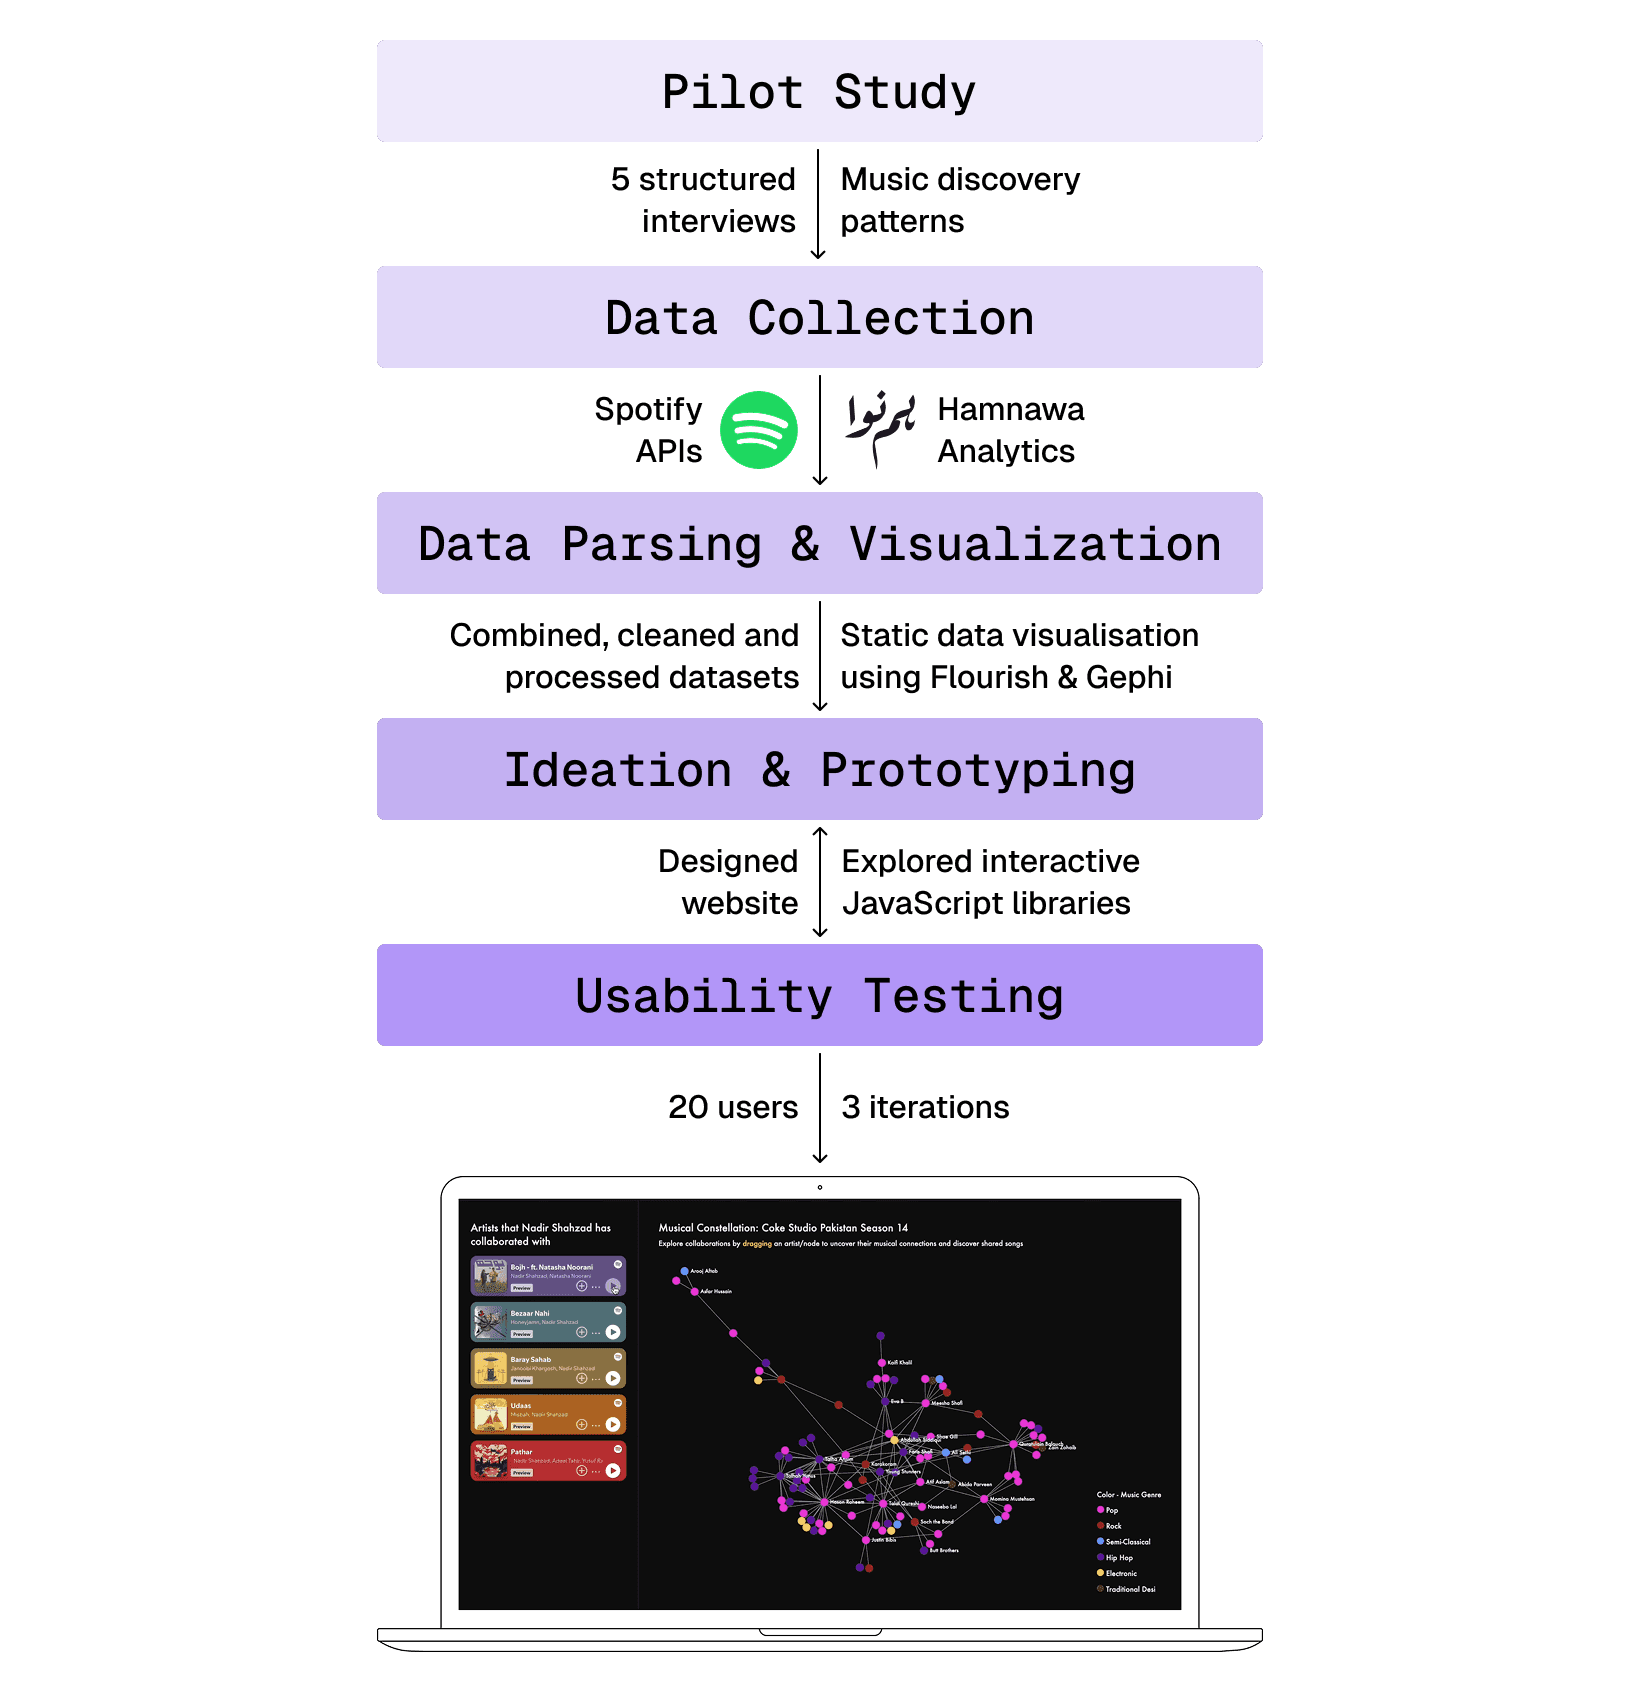
Methodology
Outcome
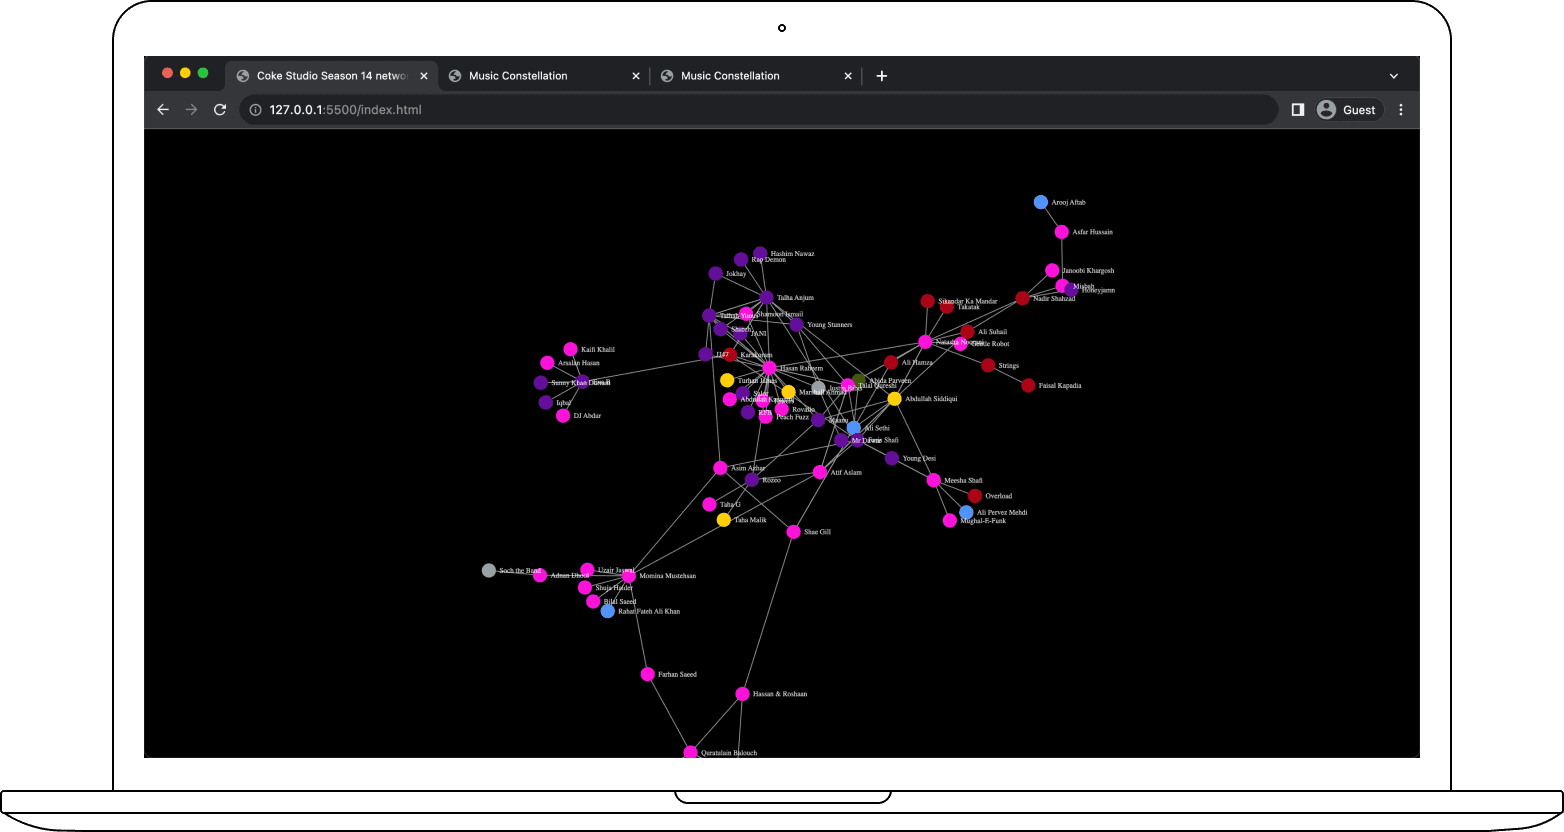
Interactive Network Website
The final solution is an interactive network graph that visually represents artists as "constellations." By selecting an artist, users can see their collaborations and listen to their music directly.
This design encourages a more deliberate and active form of music discovery, allowing users to trace connections and explore a music scene organically.
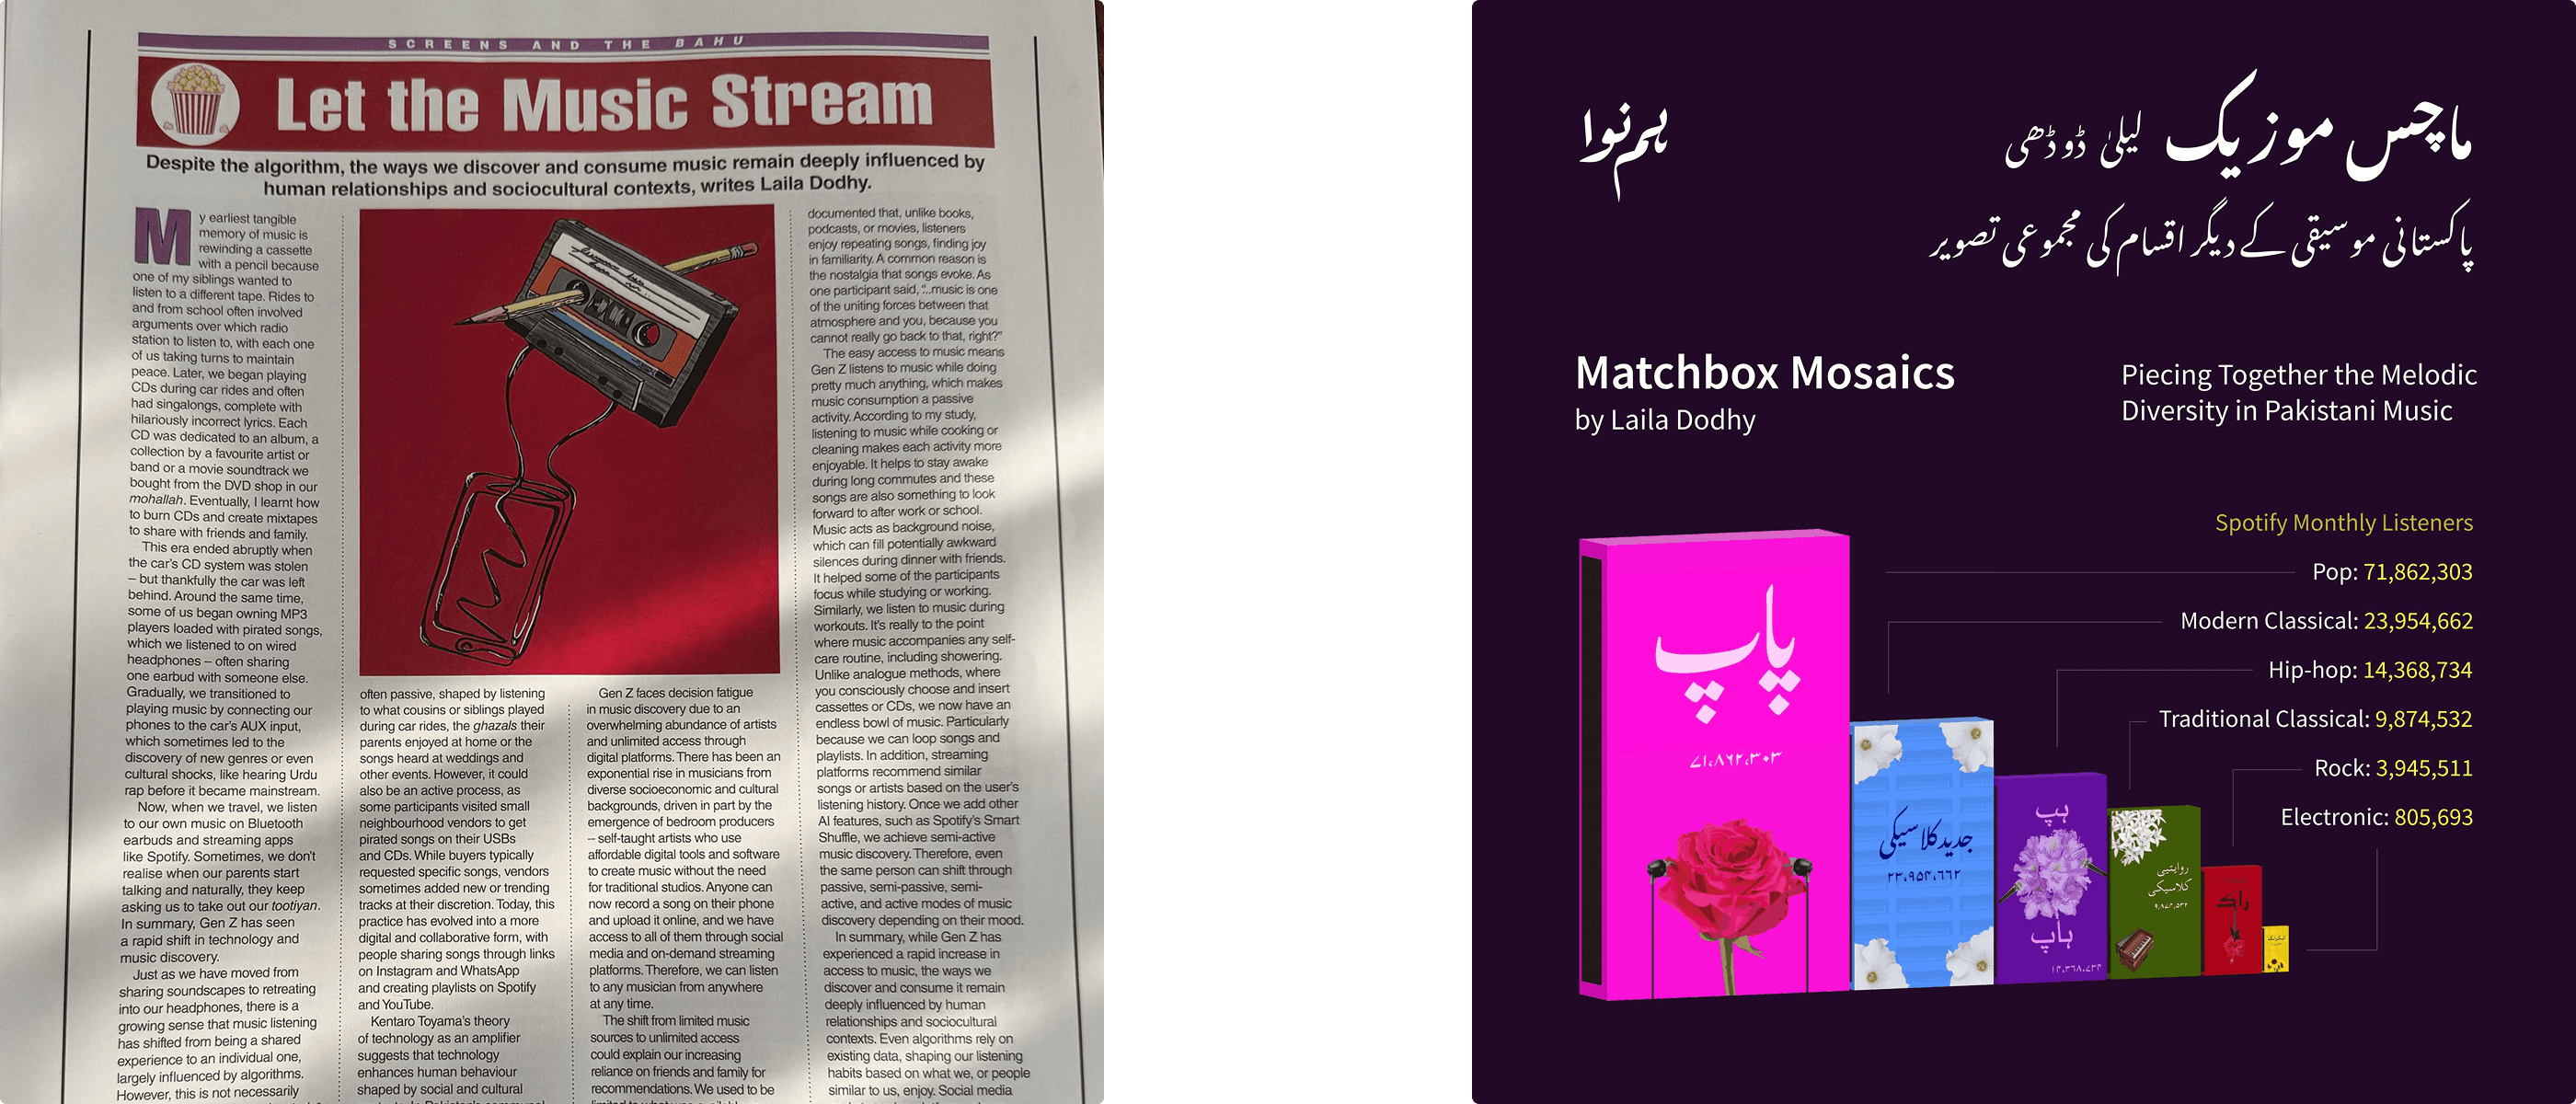
Publications
Some of the findings from this project were published in magazines like Aurora (Dawn Media) and Hamanwa.
Impact
"I can play with this all my life and not get bored" - P14
Musical Constellations successfully demonstrated that a visual, relational approach to music discovery can be both effective and enjoyable. Users found the experience compelling and intuitive, with positive feedback suggesting its potential to be a powerful tool for music lovers everywhere.
The project also highlighted a clear demand for more customization and deeper exploration, which serves as a roadmap for future development. It is currently under an NDA but aims to be publicly available in the future.
For more details about the study, you can continue scrolling.
Pilot Study
To limit the project's scope, the context was focused on Pakistani music. A pilot study was conducted via Zoom to gather qualitative insights into music consumption and discovery habits. Participants were all Pakistani and Indian music lovers, selected to represent a range of demographic factors. Interview recordings were manually transcribed due to the limitations of transcription software with combined English and Urdu speech, and a thematic analysis was then performed.
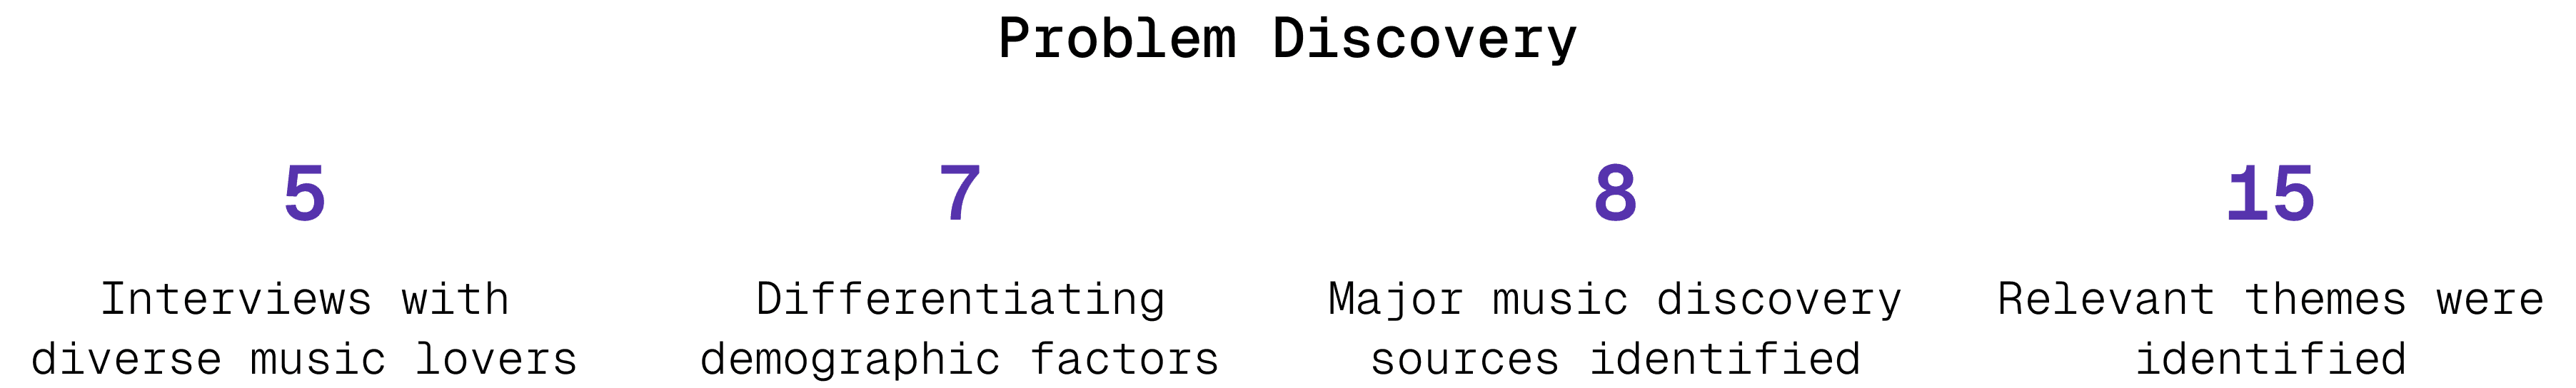
Analysis
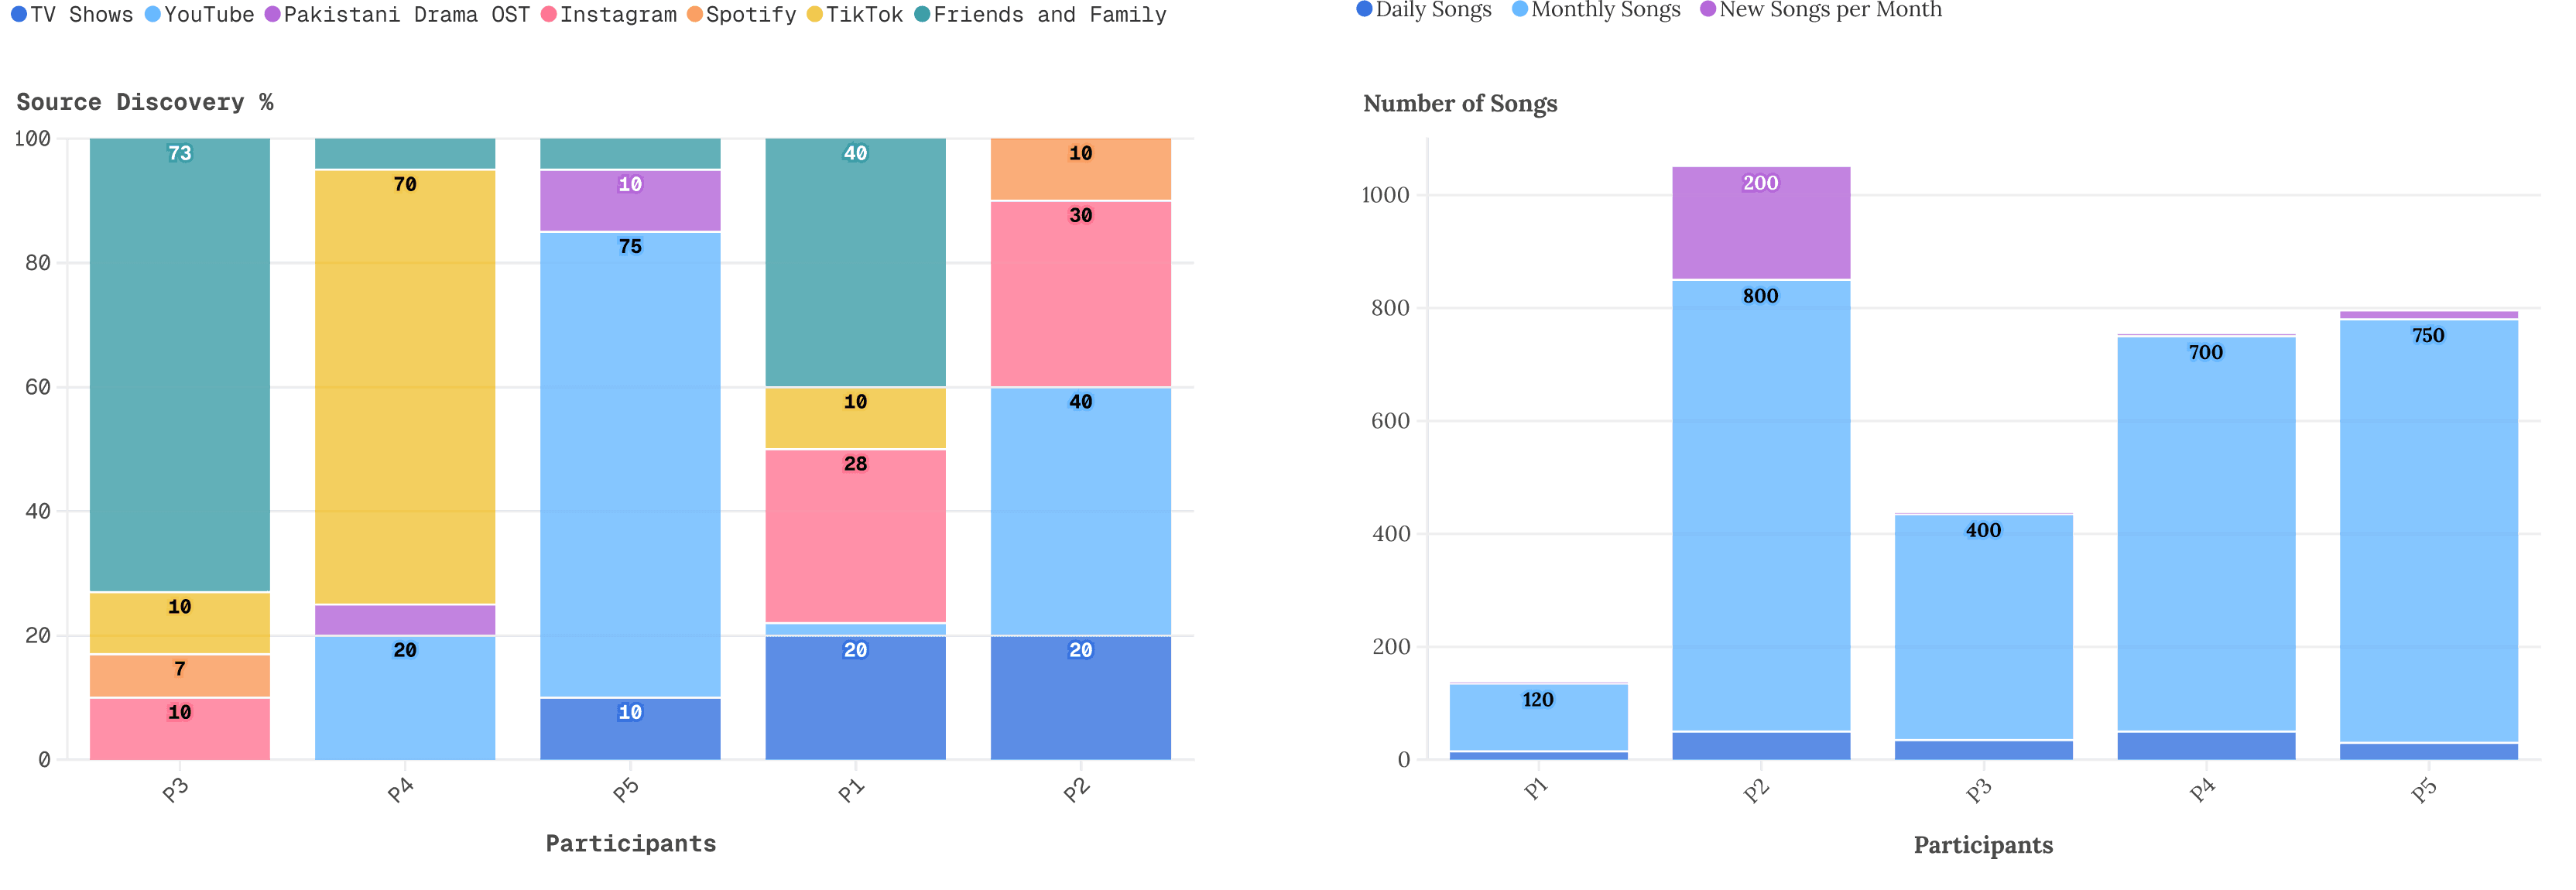
Key Findings
FINDING 1 | FINDING 2 | FINDING 3 |
|---|---|---|
Streaming services and social circles are major sources | Users are frustrated with songs trending on social media | There is a lack of meaningful music discovery |
Music discovery is both platform-specific (like Spotify and YouTube) and social, with friends, family, and social media playing a role in new song recommendations. | Interviewees expressed dissatisfaction with music created just to trend on platforms like Instagram or TikTok, noting that these songs often lack "consistency" and do not have a lasting impact. | On average, participants discovered only about two new songs per month. This indicates that while they may hear new music, it doesn't "stick" with them, highlighting a need for a more impactful discovery process. |
Cultural context
The TV program Coke Studio Pakistan serves as a vital platform for local music discovery, particularly through its emphasis on artist collaborations.
The show's ability to bring together artists from different genres, for example, a classical vocalist collaborating with a rap duo was found to be a key factor in introducing listeners to new sounds. This not only provided exposure to diverse genres but also helped overcome preconceived biases, such as one participant's initial dislike of rap music.
Hence, demonstrating the platform's power in shaping and expanding the audience's musical tastes within the local context.
Data Collection & Analysis
To explore artist collaborations and define genres in the Pakistani music scene, the project used data from Hamnawa (Pakistani pop music magazine), the only known organization with a dedicated database on the industry. This made their data invaluable for tagging artists and their genres, which was then supplemented with collaboration data from Spotify to understand the full interconnectivity of the music landscape.
Feature | Hamnawa Analytics | Spotify API |
|---|---|---|
Data Type | Pakistani music database | Streaming & artist data |
Primary Use | Genre identification | Collaboration tracking |
Data Volume | 400+ artists, 21k+ datapoints | ~11 million artists |
Output | A curated list of artists | A web of connections |
By combining data from multiple sources in a Jupyter Notebook, I created a network graph that visually represented artist collaborations and their relationships, directly addressing the project's goal of showcasing the interconnectivity of the Pakistani music scene. Below is a snippet of the final data output.

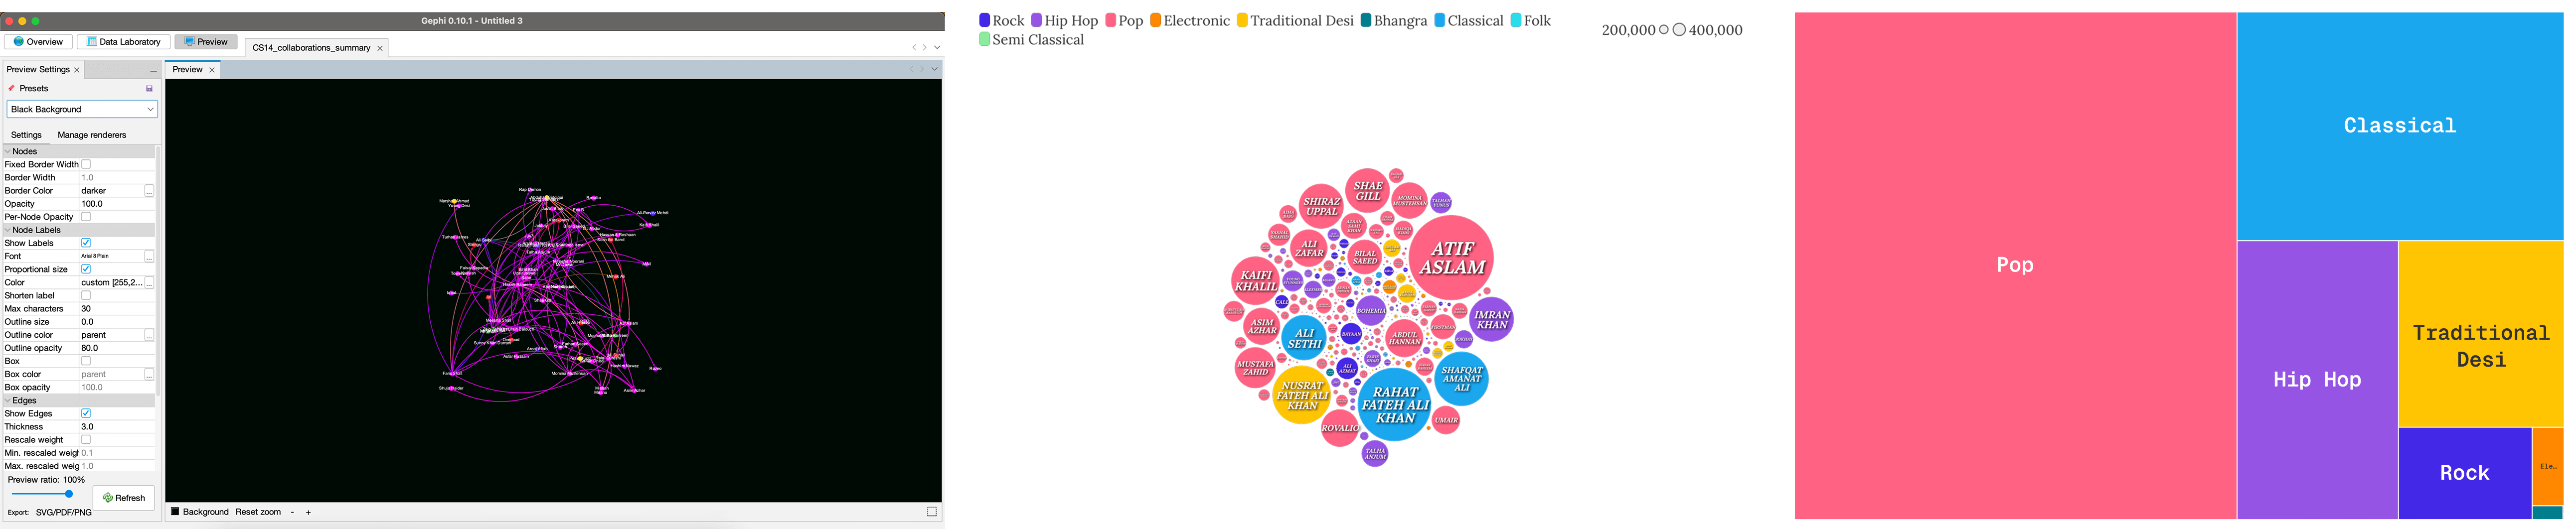
Static Visualizations
Initial data visualization using software like Flourish and Gephi revealed the immense complexity of the complete dataset. To create a digestible project, the scope was limited to the 27 artists from Coke Studio Season 14, a highly popular and well-known cultural program that provides a relevant context for music discovery. This decision was based on the insight that users often discover new artists through those they are already familiar with.
Ideation & Prototyping
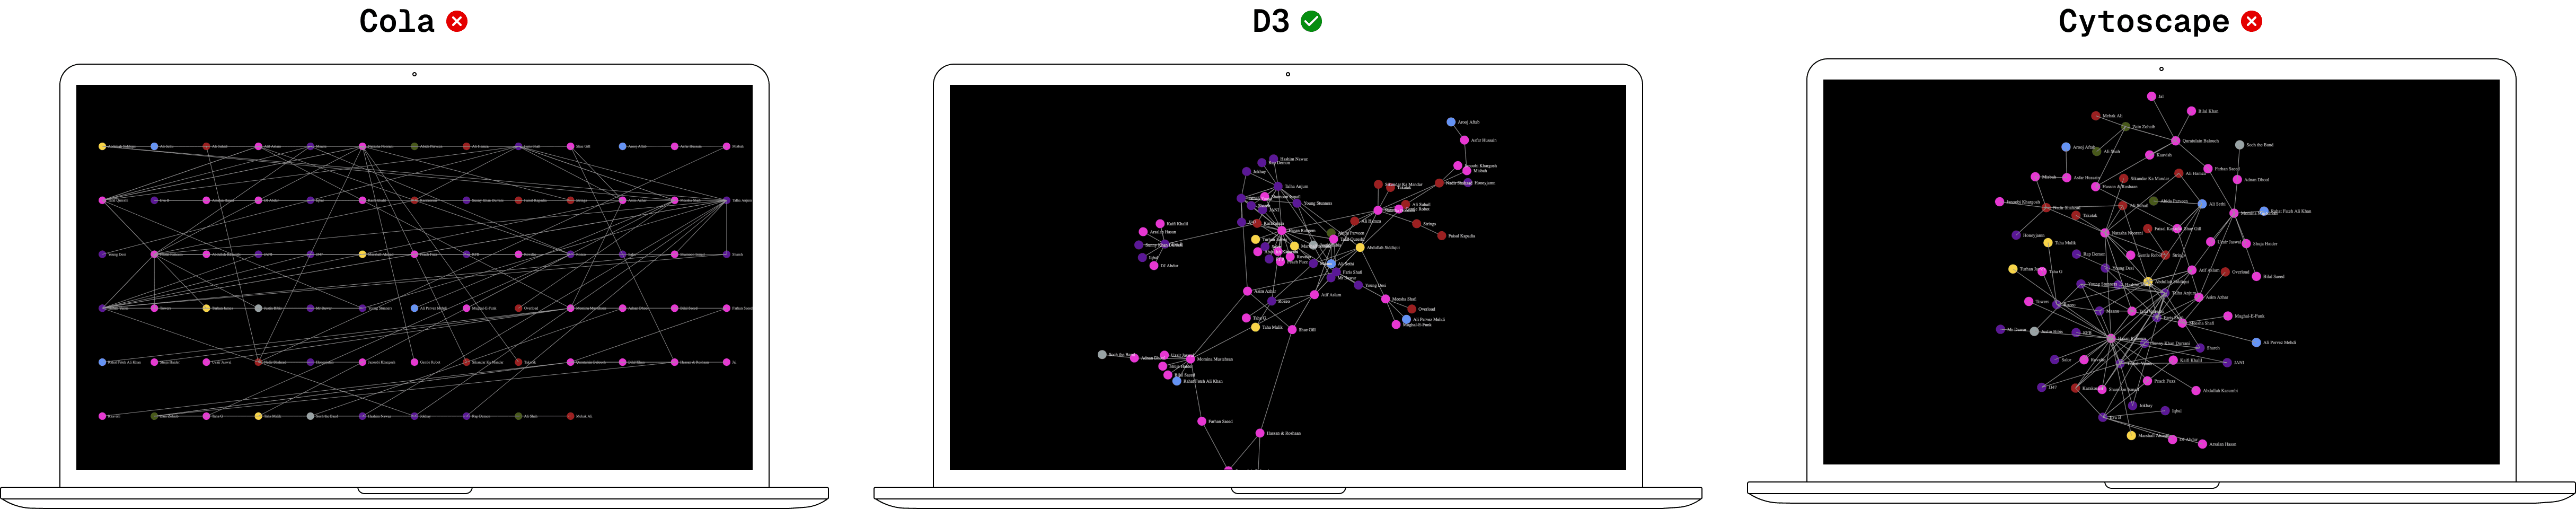
To create an interactive and engaging experience, I explored various JavaScript libraries like D3, Cola, and Cytoscape to find the optimal visualization tool. The goal was to build a dynamic graph that would show the interconnectedness of musicians.
A black background was selected with nodes colored to represent specific genres, creating a visual metaphor of a musical constellation and enhancing the aesthetic appeal of the data.
While I initially attempted to combine features from these libraries, it often led to unexpected issues. Ultimately, D3 was chosen for its superior execution and greater degree of interactivity, which was essential for an active user experience.
JavaScript Library Prototyping
Testing & Iterations
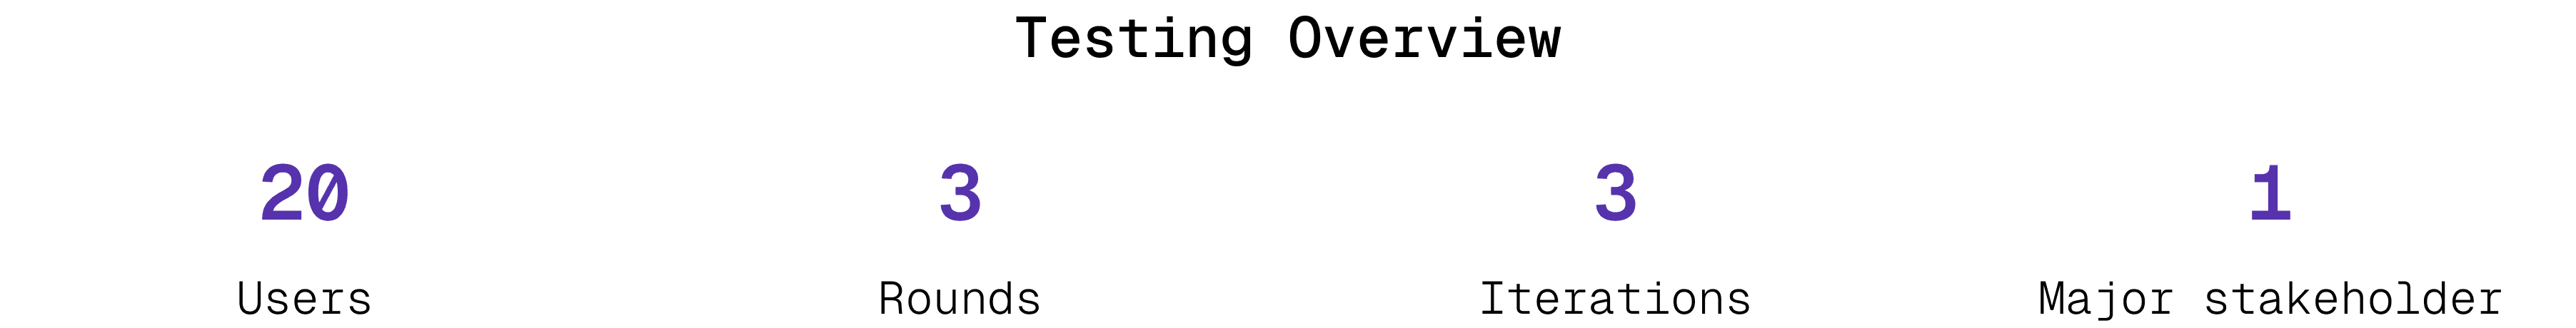
Usability testing was conducted with a total of 20 users. The project also involved ongoing collaboration with Zeerak Ahmed, the owner of the Hamnawa dataset, who remained engaged throughout the entire process.
Iteration #1 - Interactive Graph
FINDING 1 | FINDING 2 | FINDING 3 |
|---|---|---|
Too cluttered | More context needed | Need for True Interactivity |
Displaying every artist's name created a messy and overwhelming graph | Users who weren't music enthusiasts struggled to recall artist names and were confused by the colors used to represent genres. | To make the experience truly engaging, users needed the ability to listen to the tracks directly from the graph. |
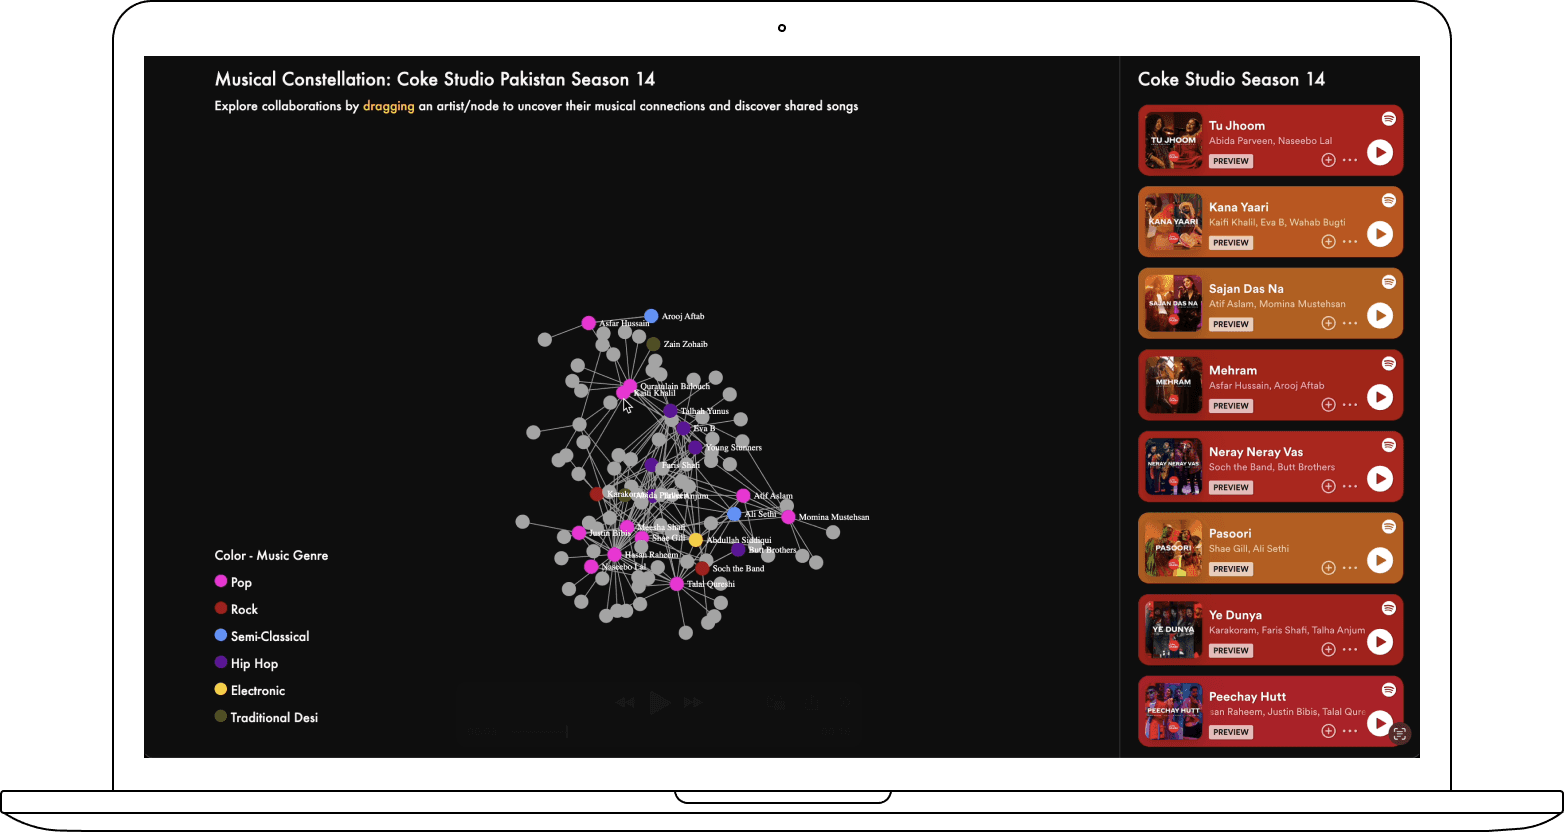
Iteration #2 - Embedded Tracks & Genre Key
FINDING 1 | FINDING 2 | FINDING 3 |
|---|---|---|
Users were too fixated on the interactive graph | Reduced cognitive load, but the text was ignored | The interface was overwhelming |
Users were so engaged with the graph's interactivity that they missed the main goal of exploring the songs | While the initial state of the graph reduced cognitive load, many users didn't read the introductory text, highlighting the need for a more intuitive and self-explanatory design. | The hierarchy of the layout needed to be re-evaluated to better guide users toward meaningful music discovery |
Iteration #3 - Improved Hierarchy & Copywriting
"I can imagine seeing this in an art museum or gallery" -P12
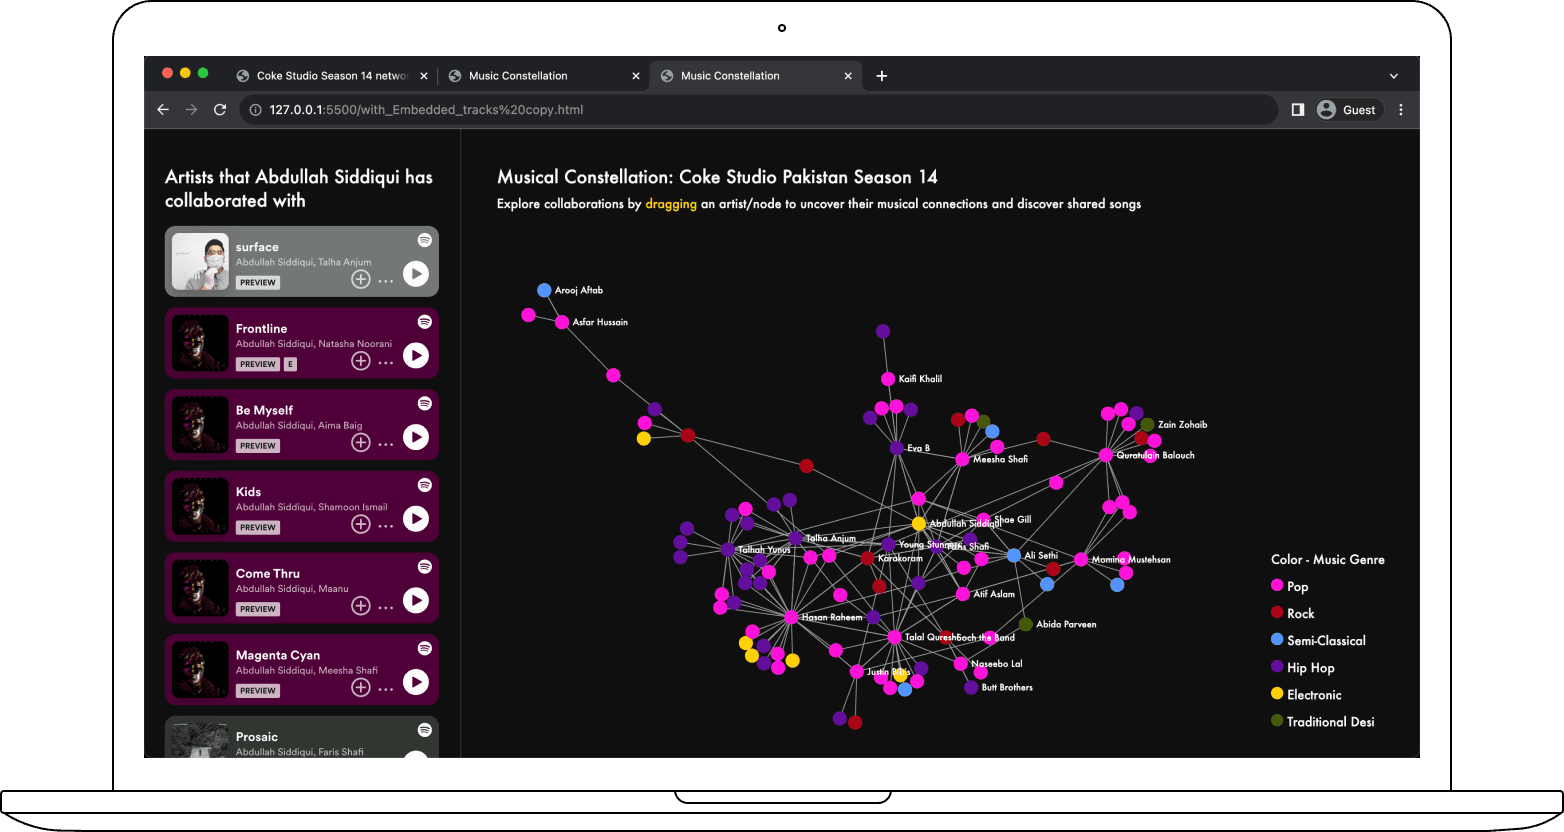
FINDING 1 | FINDING 2 | FINDING 3 |
|---|---|---|
Improved User Flow | Clarified Language | Need for Zoom |
The interface components were rearranged to encourage users to interact with both the network graph and the music tracks, resolving the previous issue of users fixating on just one element. | The copy for the Spotify tracks was changed from a generic description to "Artists that {selected artist} has collaborated with," which more accurately explains the relationship and guides users toward a meaningful discovery experience. | User testing revealed a desire for a localized zoom feature, as people wanted to zoom in on specific clusters of artists to see the graph more clearly. |
Future Works
Based on user feedback, the project has several opportunities for future development:
Customization: Users want more personalized experiences, like adding their own favorite artists or exploring specific genres like "Karachi rap." This highlights the need for a customizable platform.
More Interactivity: The genre key should be interactive. This suggests that users are more likely to engage in active music discovery when they are given the opportunity to explore on their own. Future iterations will also need a zoom feature and larger nodes for better usability.
Enhanced Recognition: Participants had trouble identifying artists without photos or music videos, indicating that track covers aren't enough for recognition. The project also needs to reclassify simplified genres to better reflect culturally specific categories like qawwalis and ghazals.
Reflection
This project was deployed on a local server due to an NDA. My next goal is to expand its scale and make it publicly accessible, moving beyond a lab setting to gain a more holistic understanding of how people experience music. I am grateful for the guidance of Zeerak Ahmed from Hamnawa.
Musical Constellations was also my attempt to create a fun and engaging data visualization, proving that data can be accessible and exciting rather than something intimidating.